
Today, I want to give you a quick glimpse into how we look at reporting inside Inscaler.
(You will also get access to all Inscaler data - real data) 😅
Over the years, I've built and rebuilt hundreds of CRMs for early-stage startups - and reporting is always one of the toughest parts to get right.
Here's what I usually find:
Both are equally bad.
So, let's fix that.
I'll show you what my reporting looks like - simple, practical, and effective.
You can replicate the same logic inside your own company.
First things first.
If you're building your first or second sales team, dashboards are not optional.
You and your team need to see what's happening to understand where you're going.
Reports don't just show results - they highlight behaviours.
And behaviours are what really drive growth within your sales machine.
Let's start with the essentials:
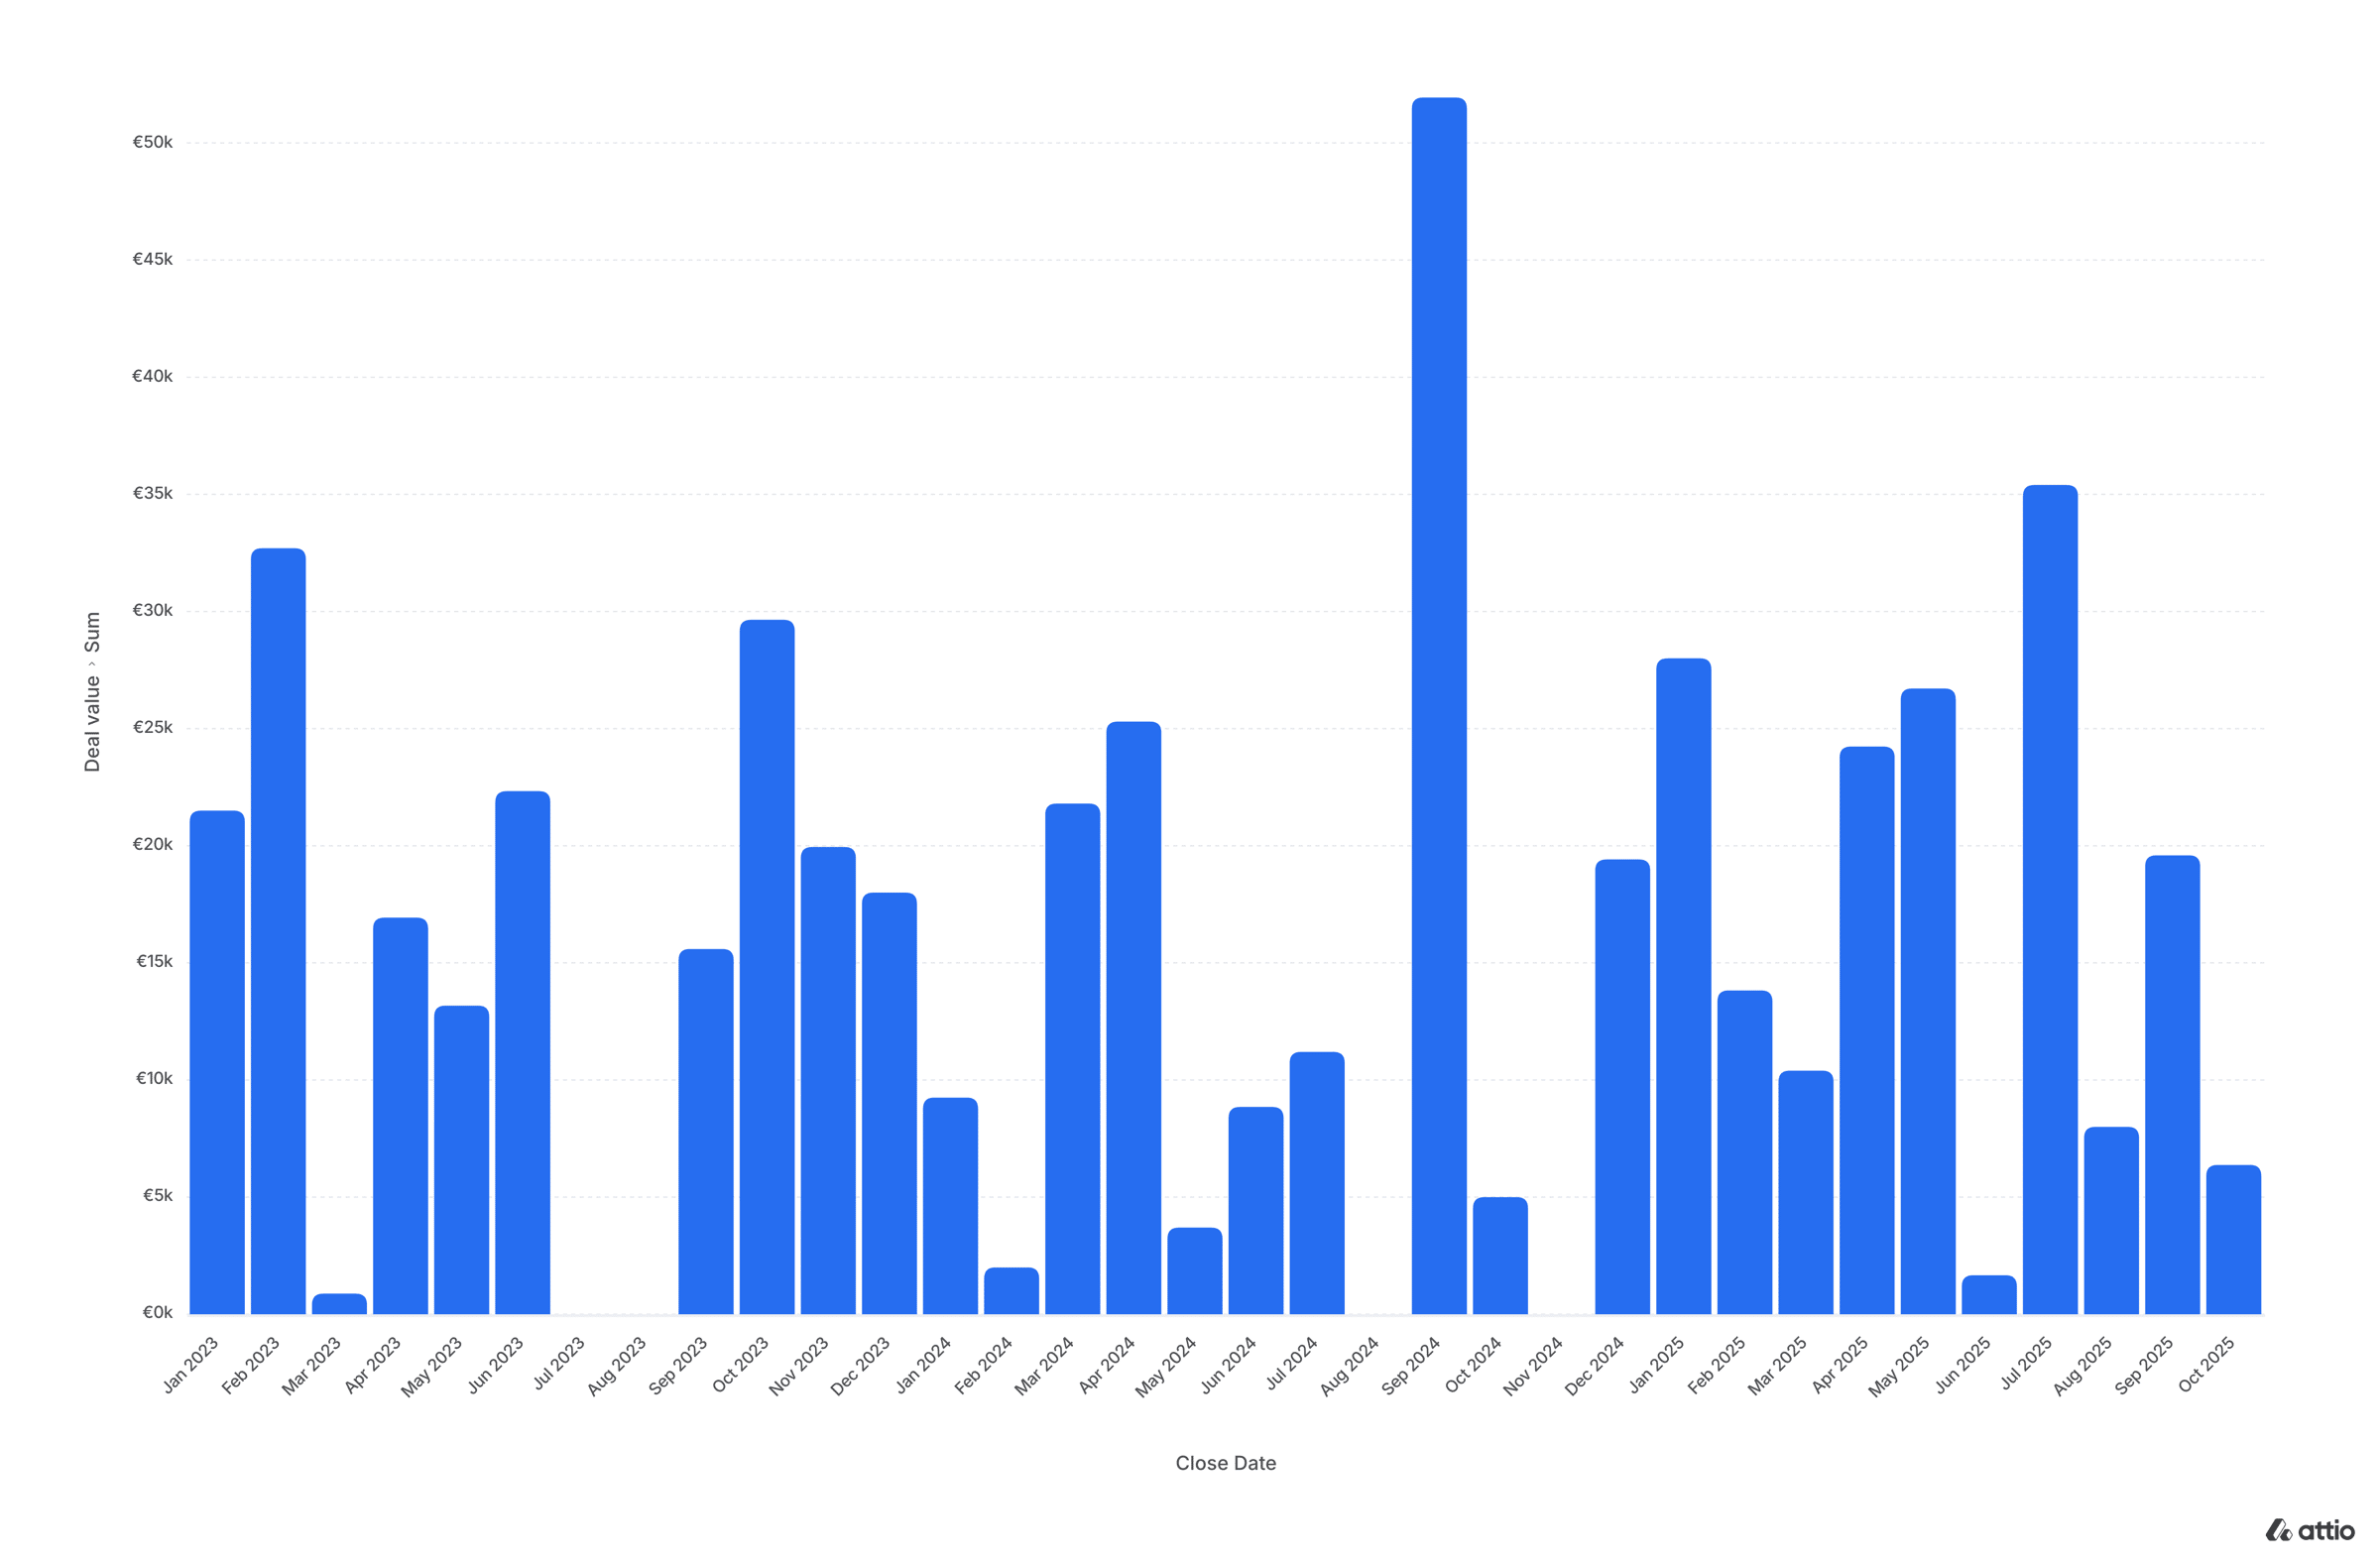
Closed Won (by Month)
This is your scoreboard. It shows how much business you're closing - signed contracts, not promises.
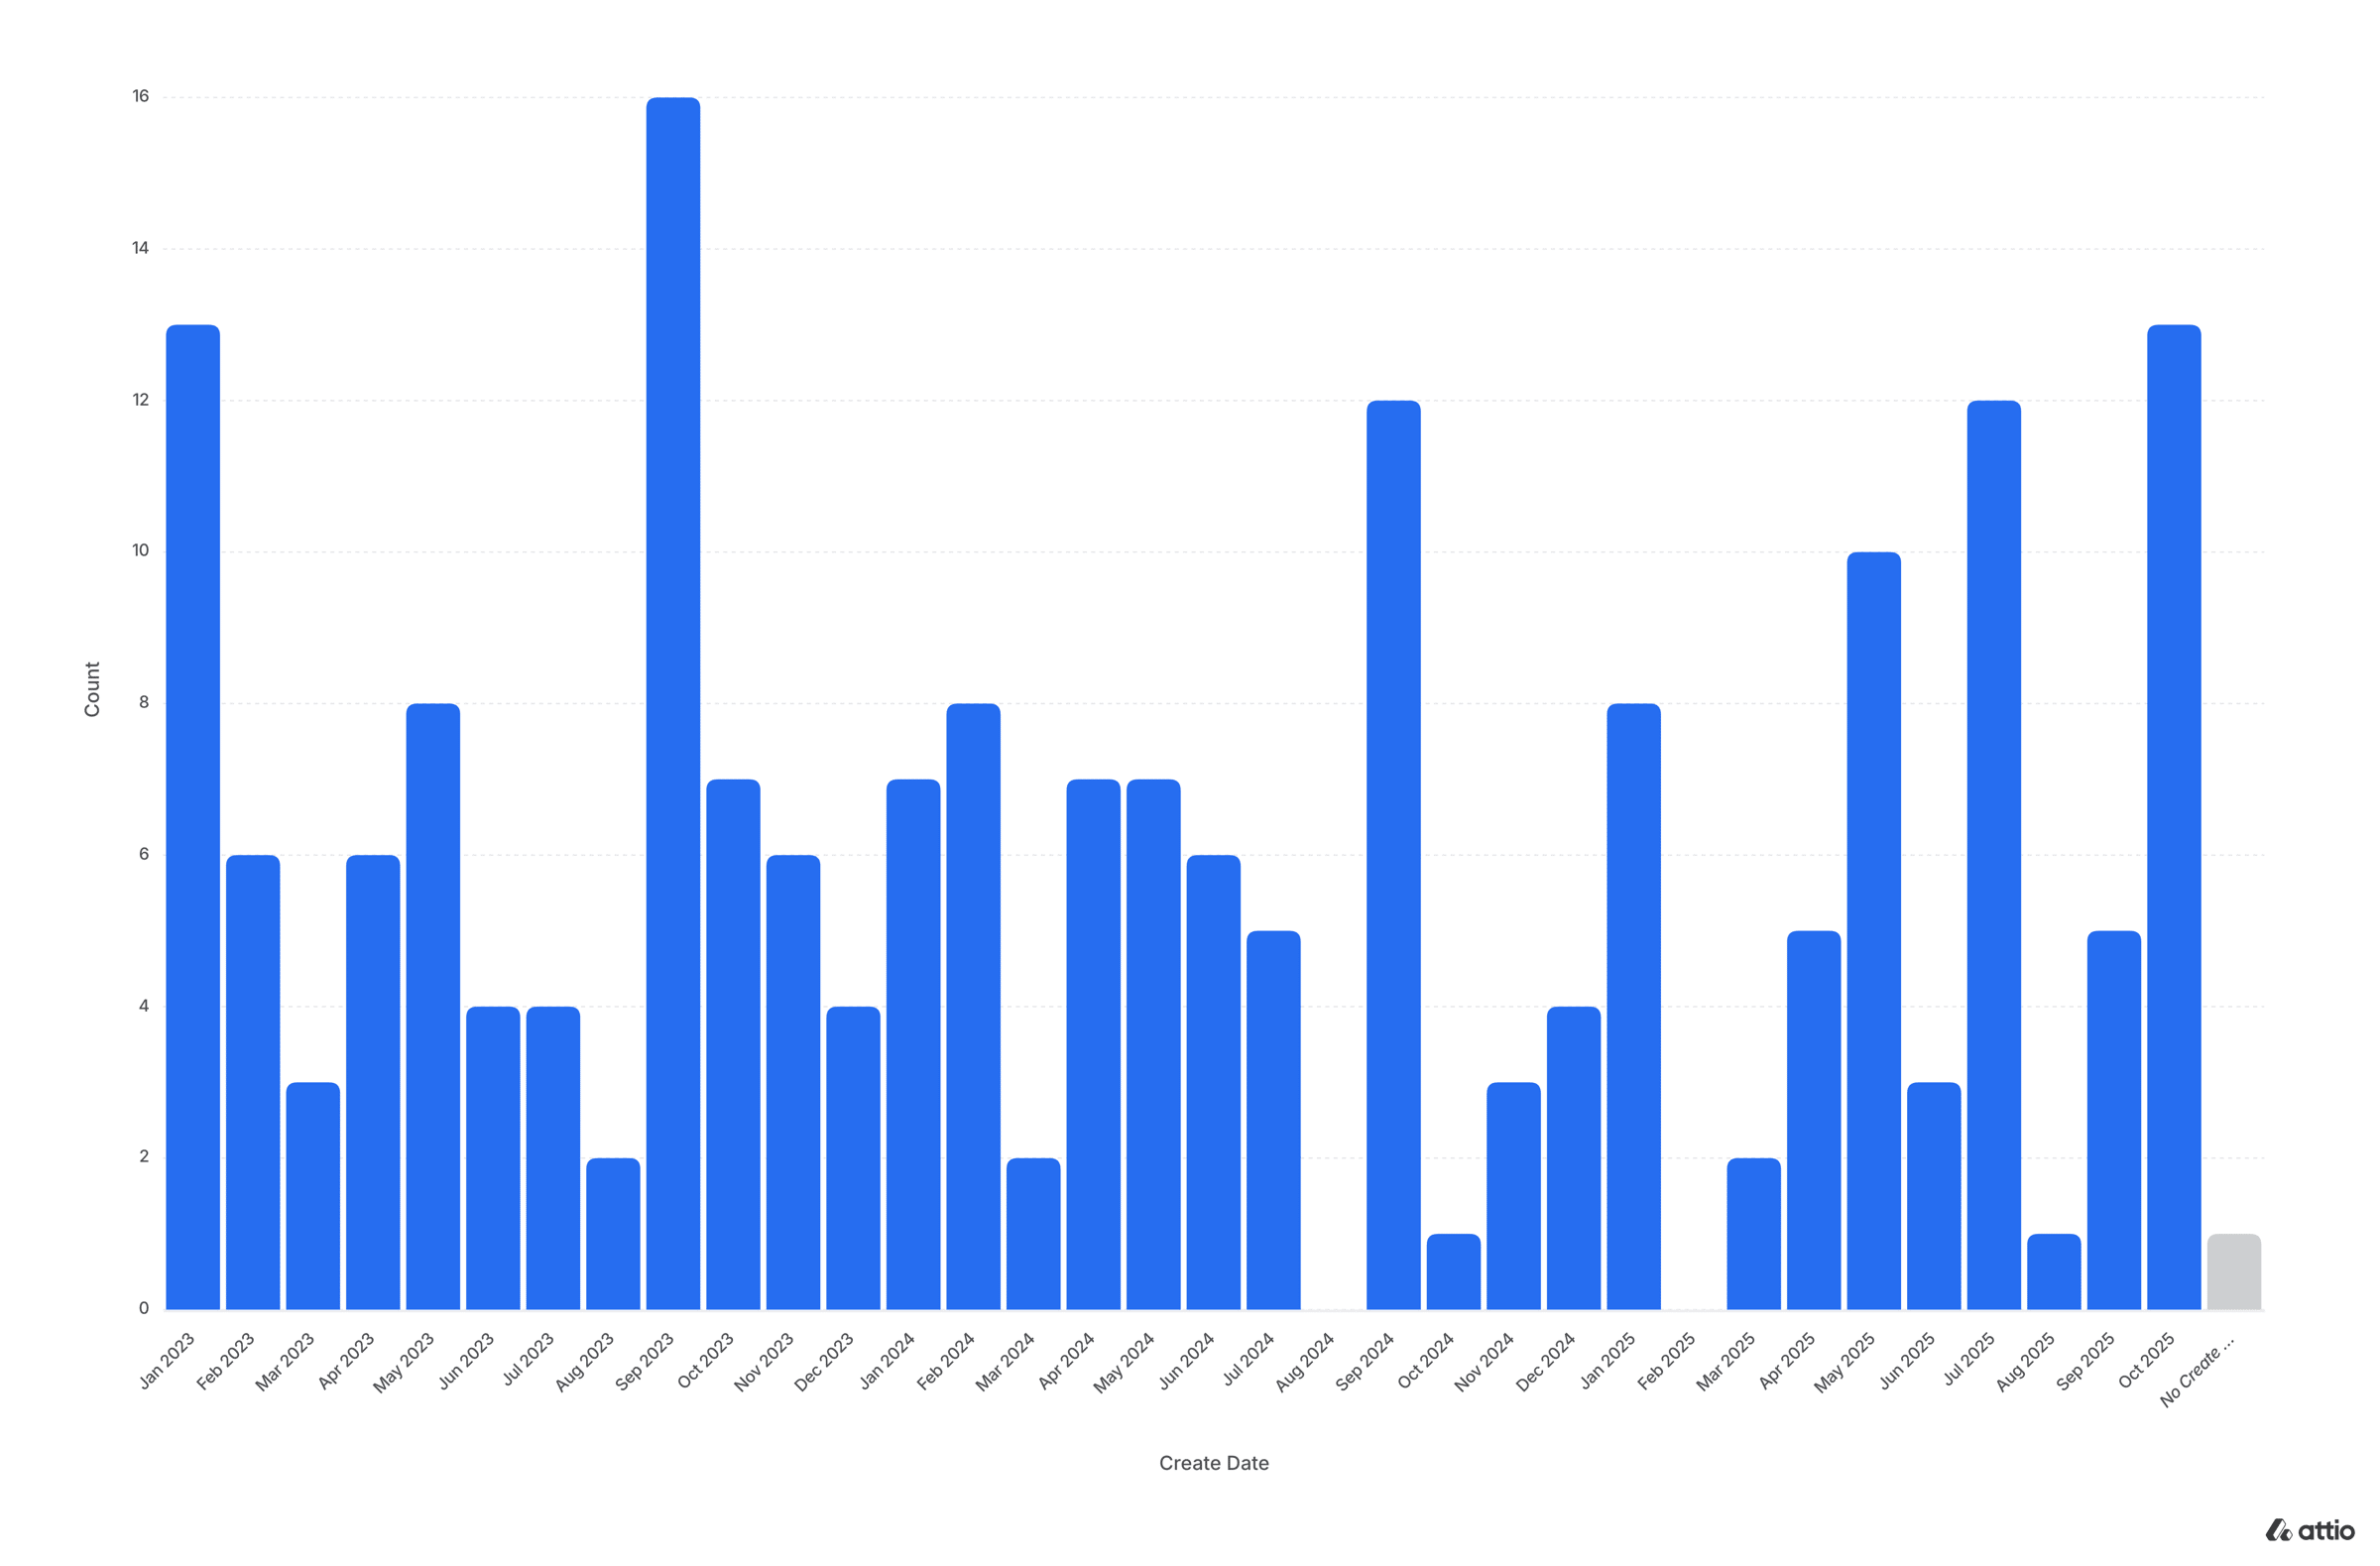
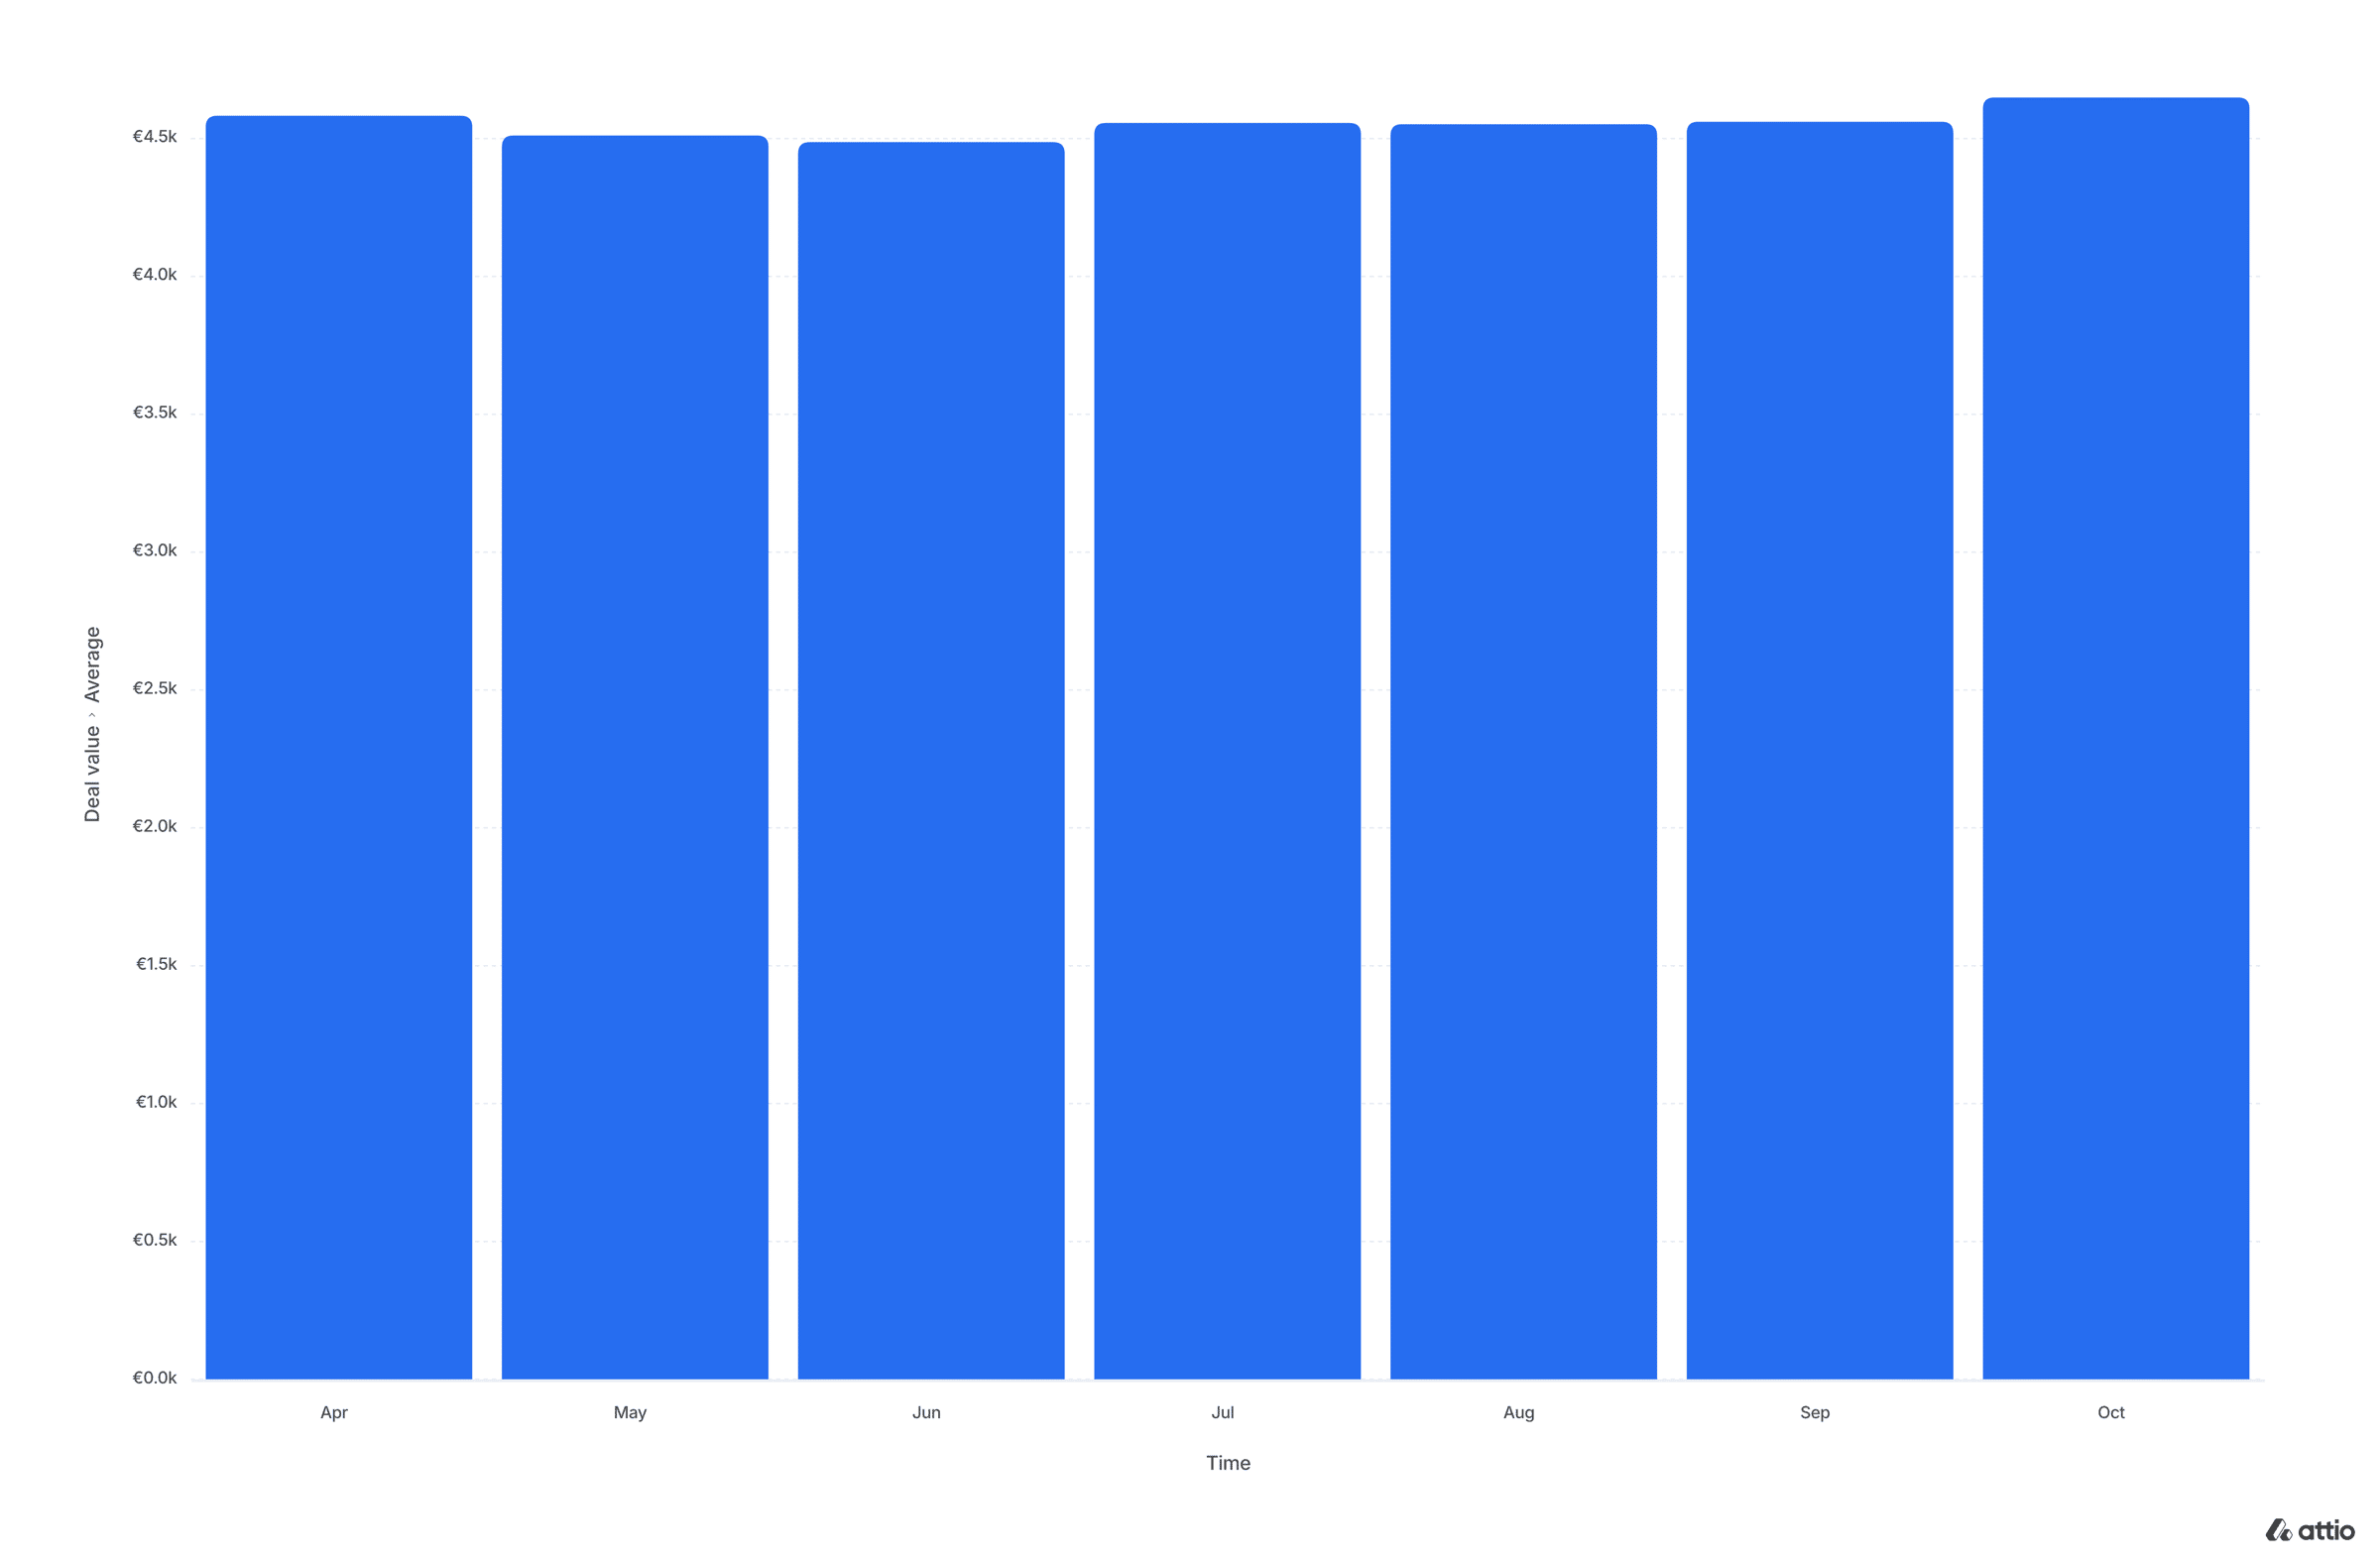
Pipeline Creation
Every sales leader should track how many new deals are created each month. No new deals = no new revenue. Simple as that.
Closed Lost
Don't just count them.
Dig into why you lost. Wrong ICP? Poor qualification? Bad timing?
This report often reveals the real health of your process.

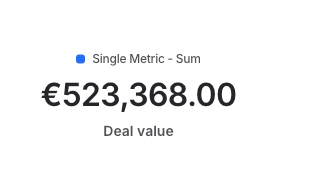
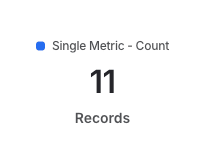
Every dashboard should have a "quick view" - one figure per metric, easy to read in 5 seconds.
Here's what I recommend showing:
It sounds basic, but it helps you and your team stay grounded in what truly matters.

Once the basics are straightforward, it's time to go deeper.
This is where you start driving behaviour.
What do I mean by that?
A few core habits should guide every sales team:
You can't improve what you can't measure — and that's where these reports come in:

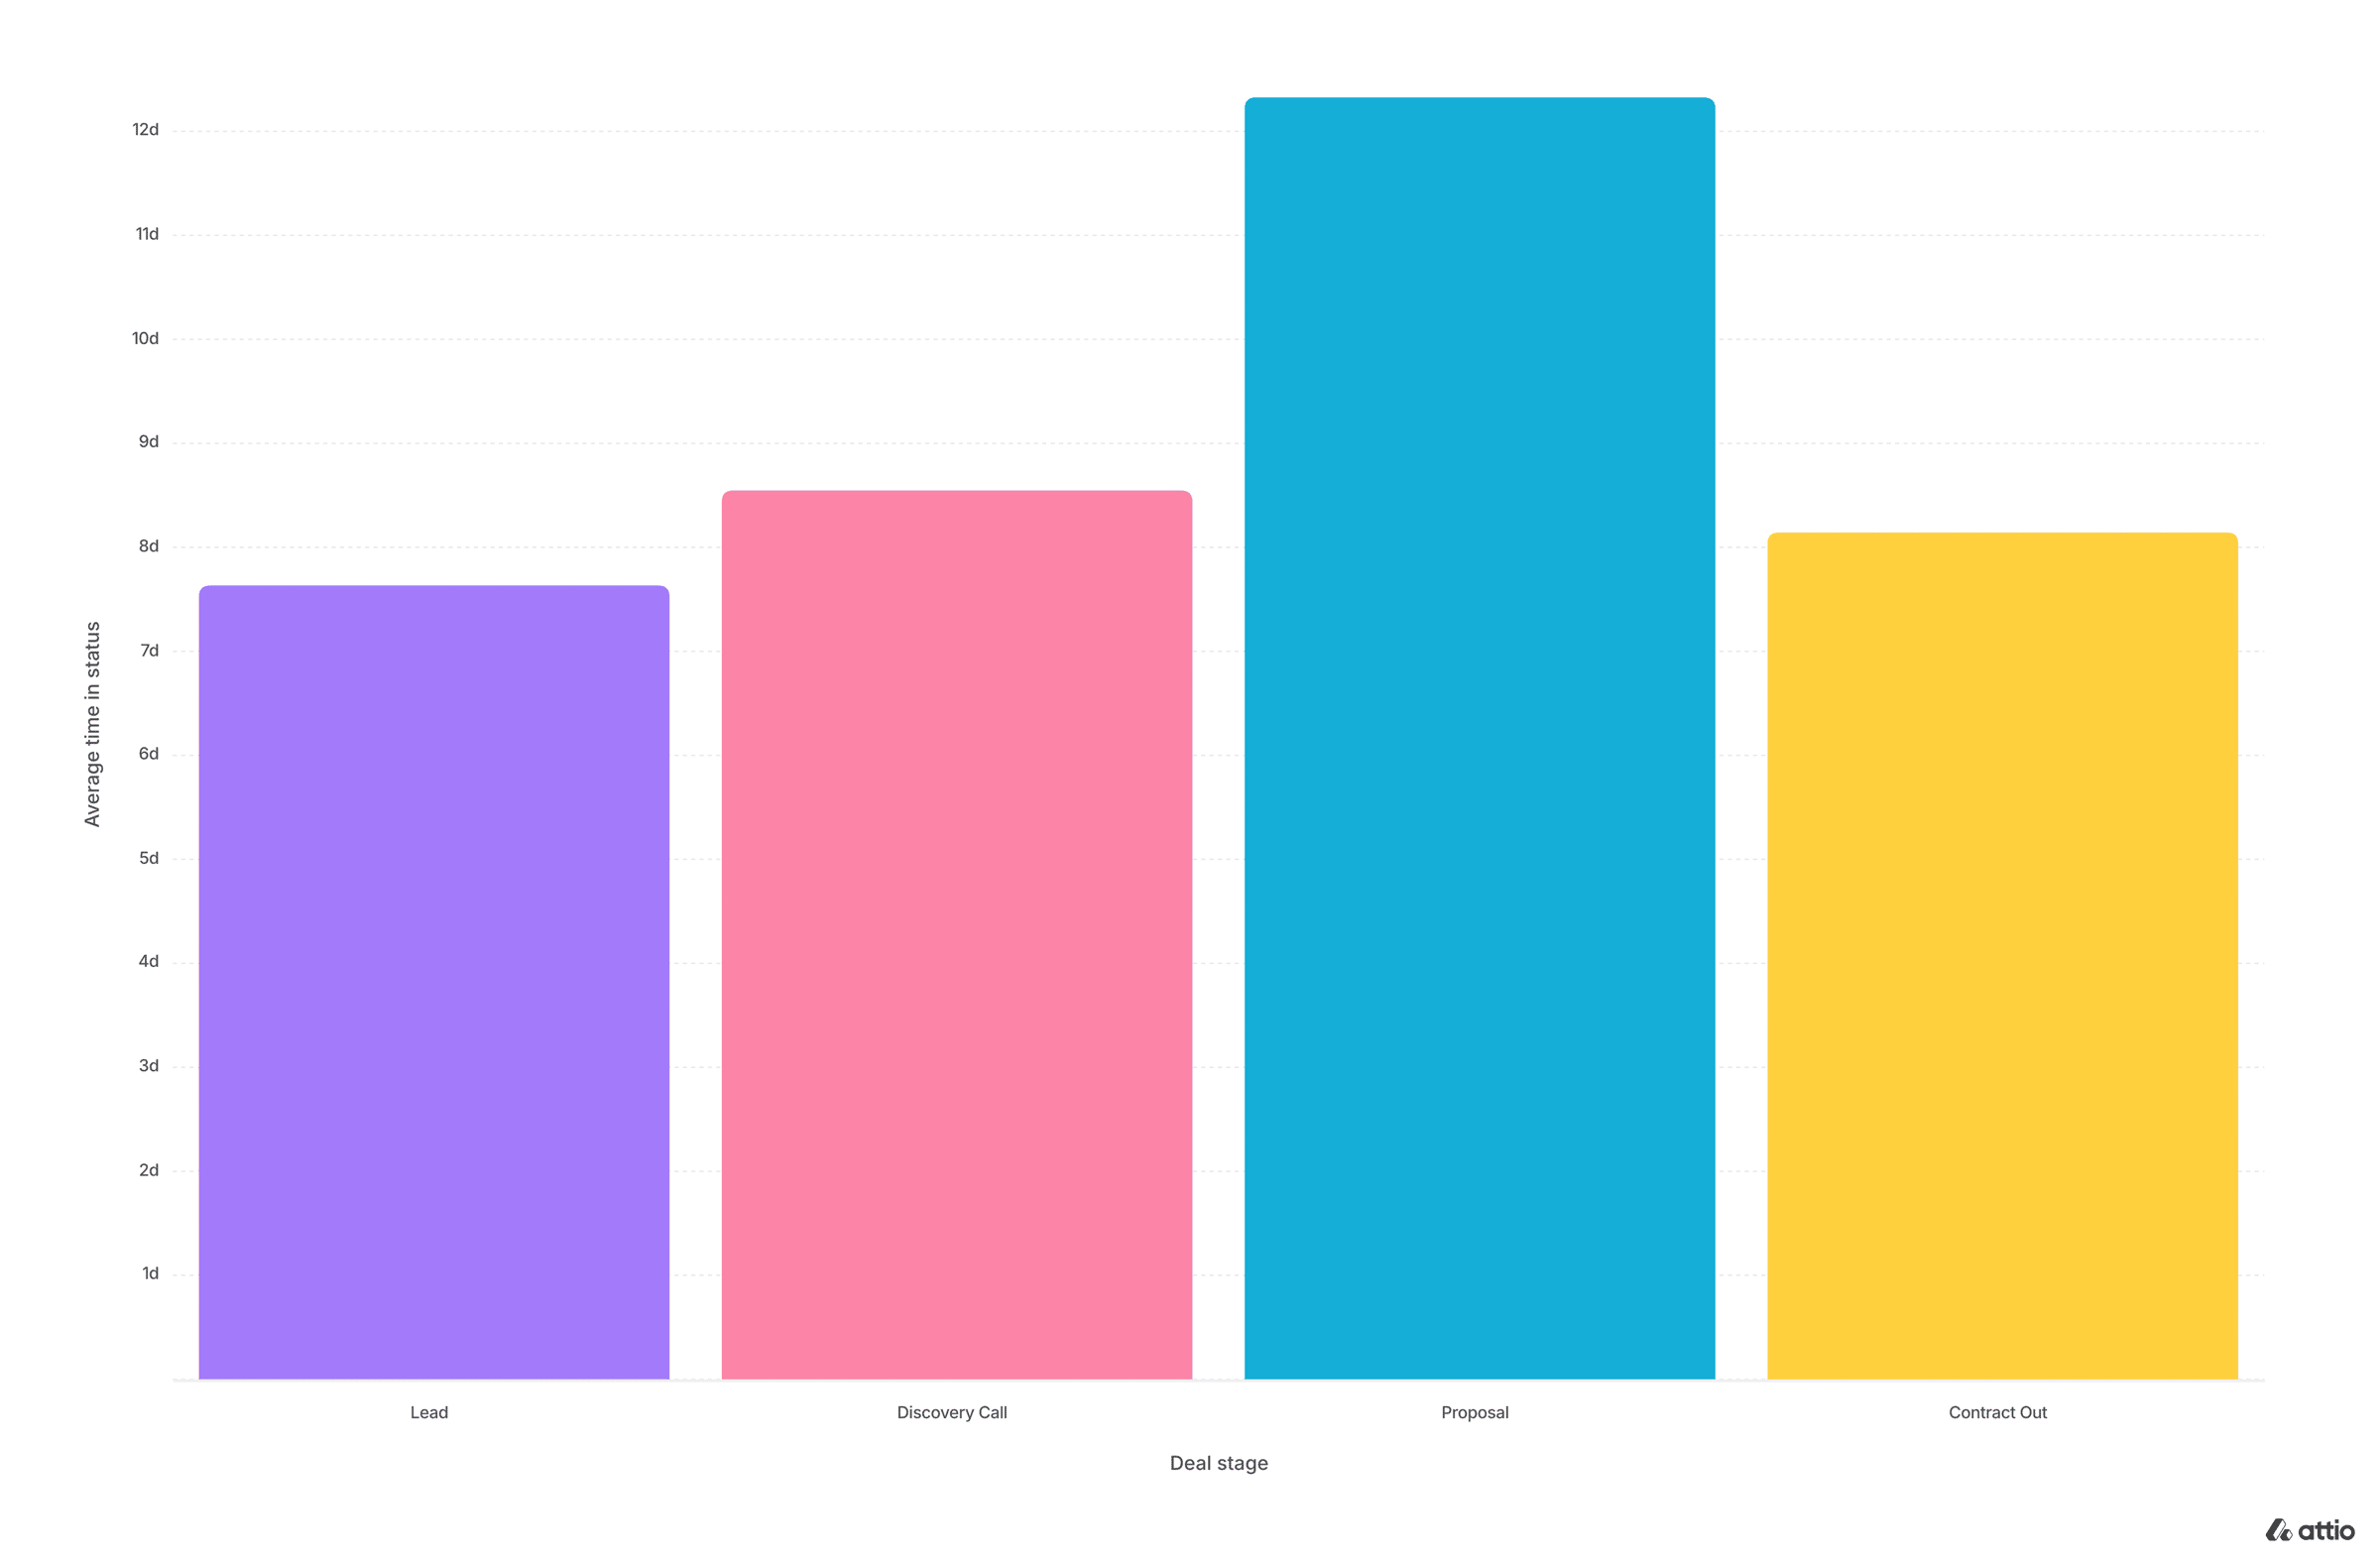
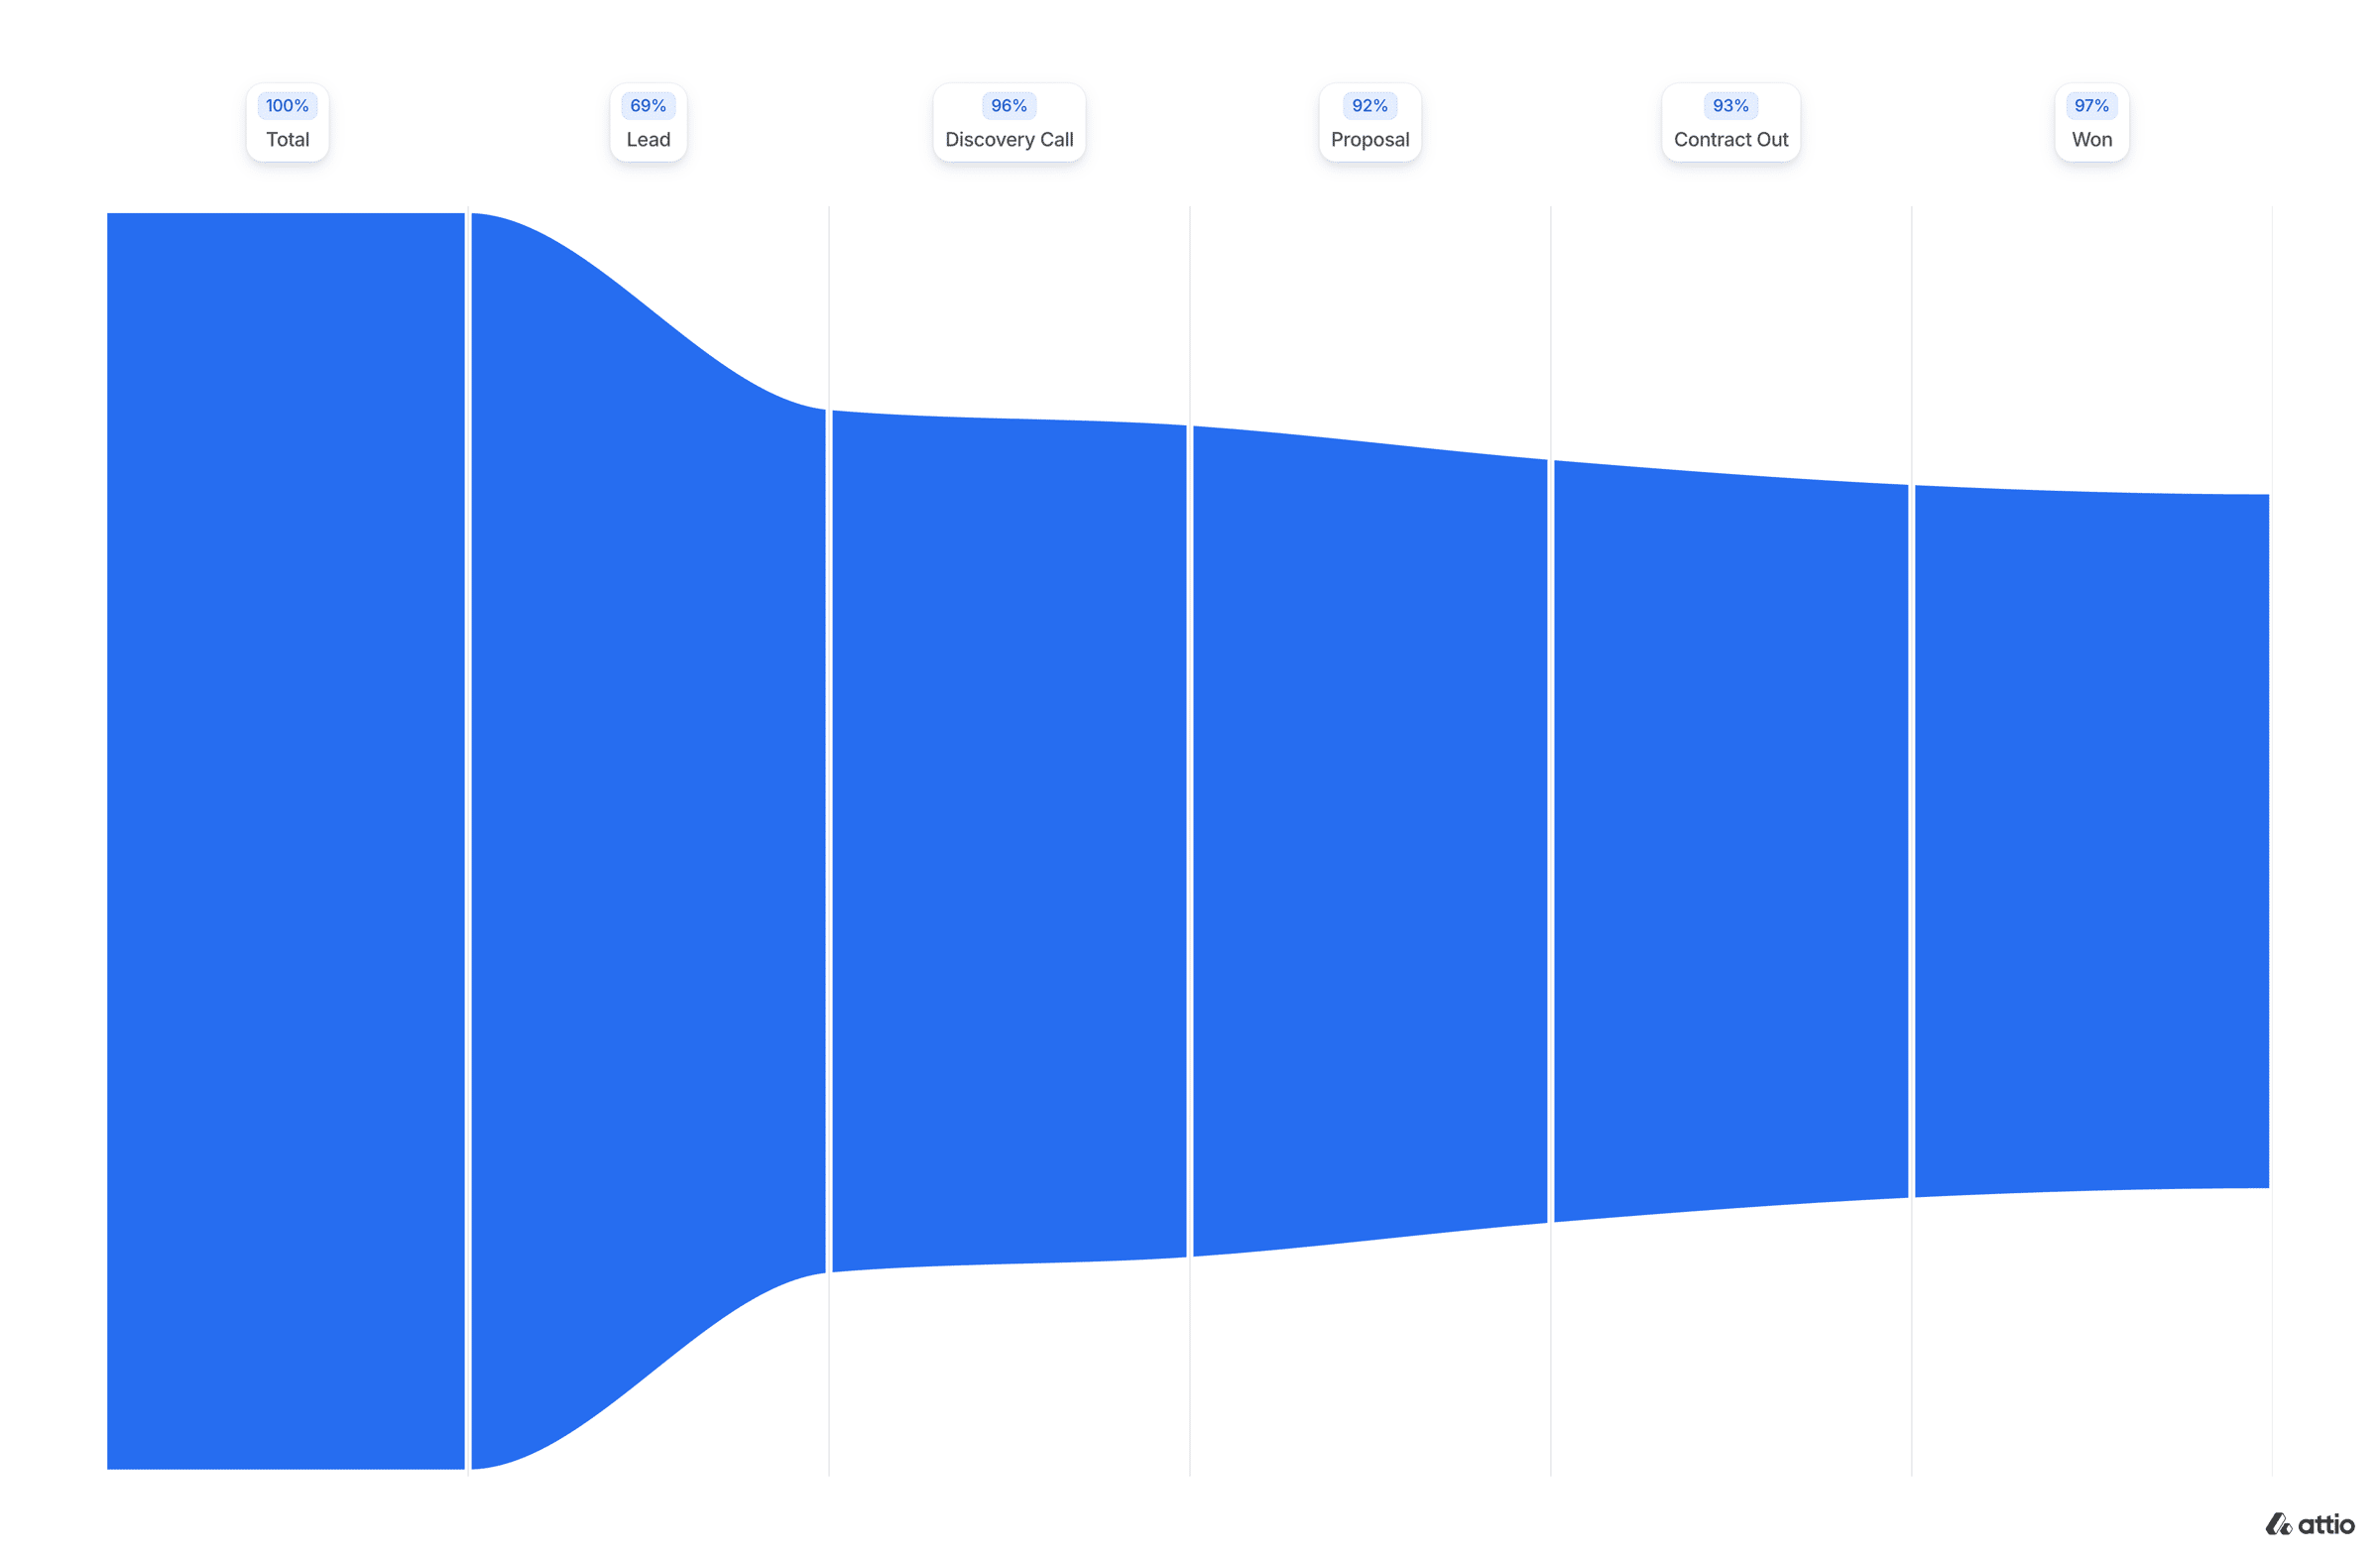
As you can see, these reports aren't complicated.
I built them for my own business, and they work.
If you're under €2M ARR, you don't need fancy analytics - you just need clarity. Start with these dashboards.
Get comfortable reading them every week.
Once that's part of your rhythm, you can layer in more advanced data later.
Because great sales reporting isn't about how many graphs you have, it's about how clearly you can see where to focus next.
Thanks for reading this far - see you all next week.

